free & open source · MIT

Trace & debug your PHP app.
No Xdebug, no extensions.

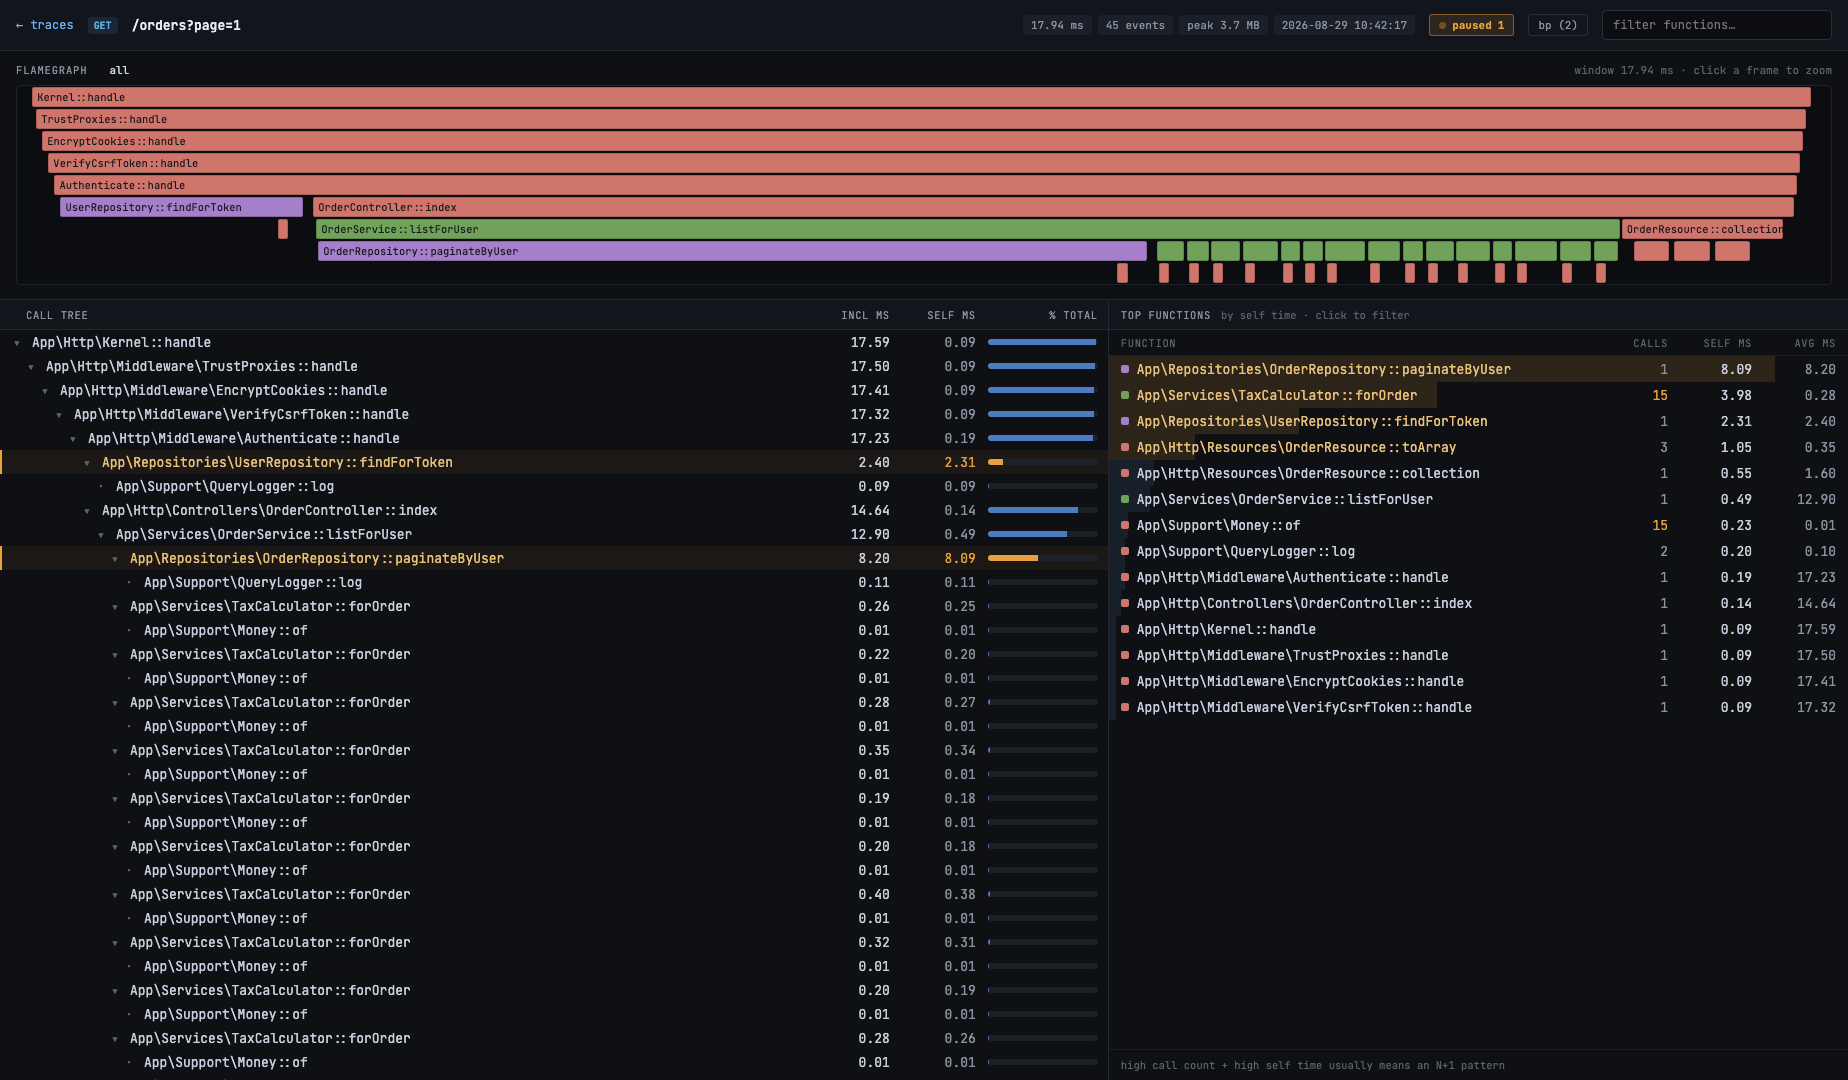
filo is a zero-extension call tracer for PHP. Record any request, then explore it as a flamegraph, a call tree with self-time hotspots - or pause it live and inspect variables at a breakpoint.

View demo
up and running in three commands
$ composer require --dev giacomomasseron/filo
$ vendor/bin/filo on
tracing on: every request now writes a trace
$ vendor/bin/filo serve
viewer running at http://127.0.0.1:8090
filo - GET /orders?page=1 · 17.94 ms · 45 events
filo trace view: flamegraph, call tree and top functions
LIVE DEBUGGER

Pause a request. Look inside.

Set breakpoints on a function, method or closure. When a request hits one, it shows up in the paused panel - local variables laid out, arguments expanded - and continues on your command. No IDE, no Xdebug session dance.
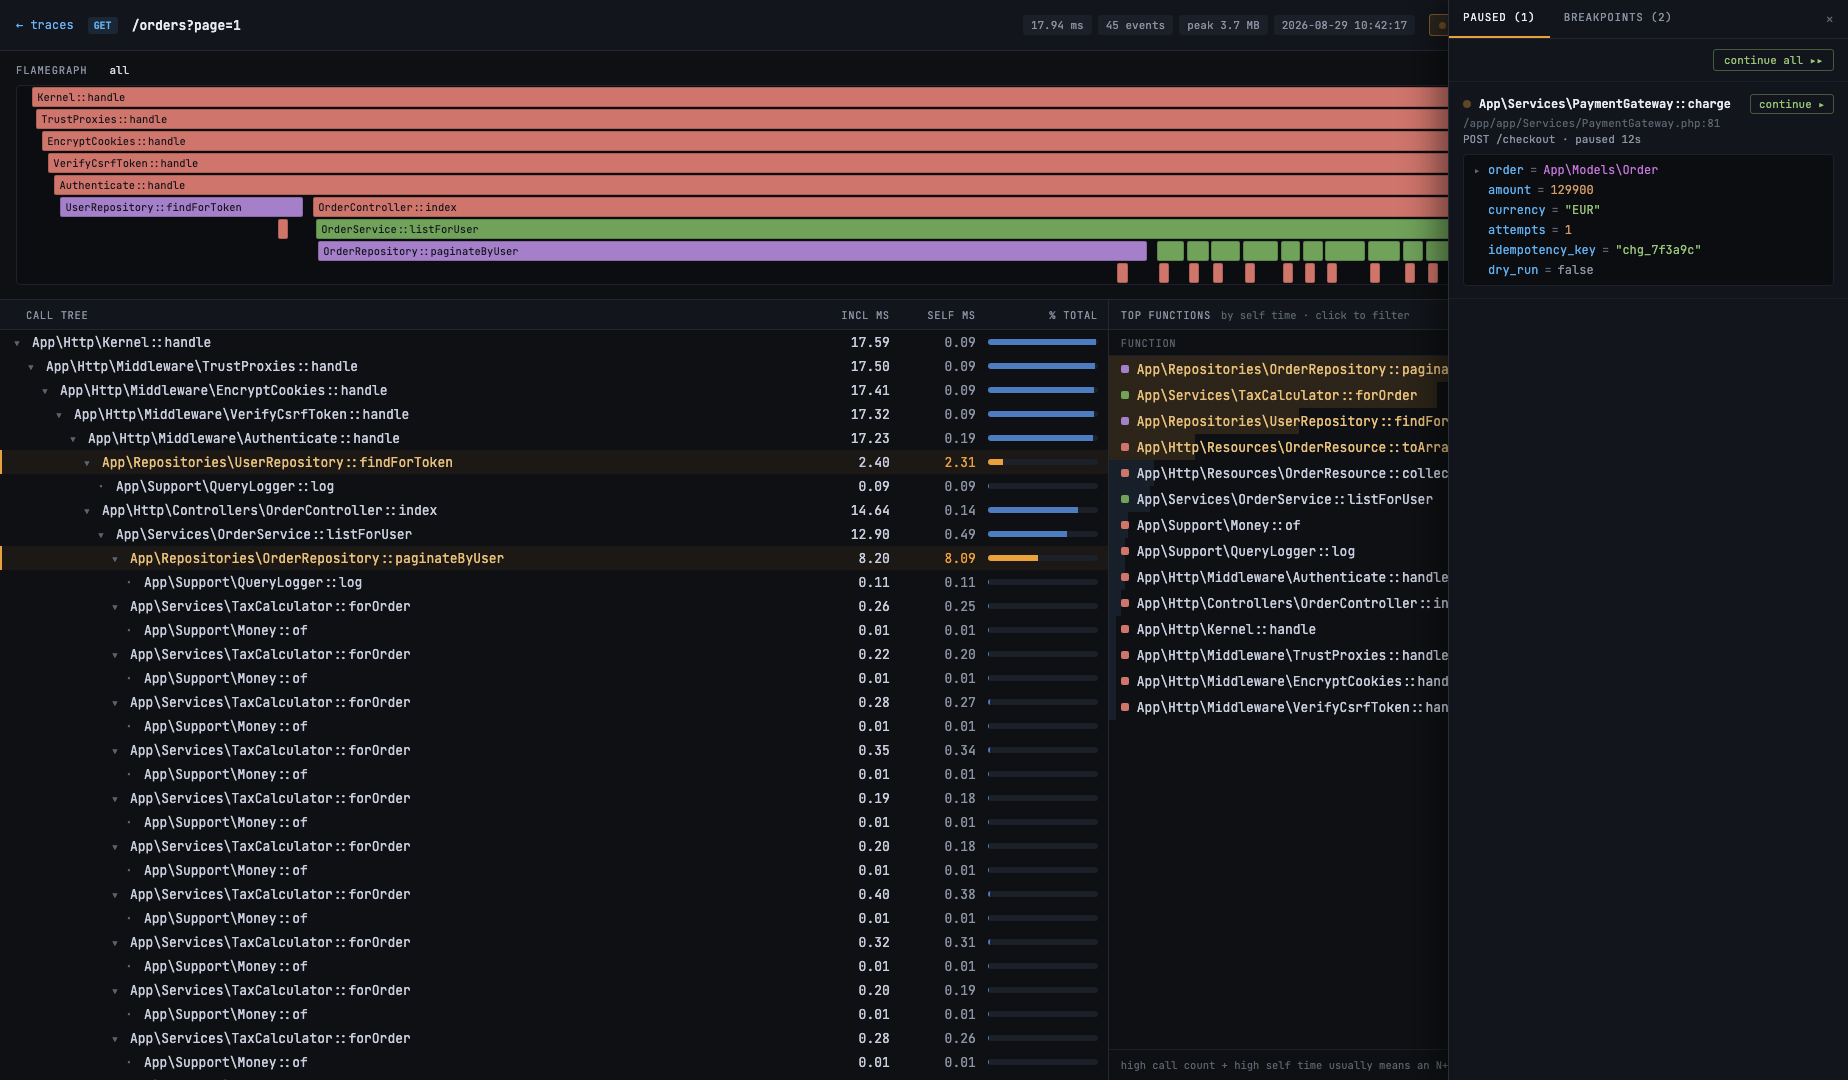
filo debugger drawer: a paused request with its variables

Everything a tracer should do

flamegraph
Zoomable flamegraph
Every call laid out on the timeline. Click a frame to zoom, breadcrumbs to climb back out.
call tree
Call tree with self-time
Inclusive vs. self milliseconds per call, hotspots highlighted - overlapping middleware handled correctly.
top functions
Top functions
Aggregated by self time. High call count plus high self time usually means an N+1 - filo makes it obvious.
debugger
Live breakpoints
Pause running requests as a function or closure is entered, inspect variables in the browser, continue when ready.
zero-extension
No PECL, no recompile
Pure PHP instrumentation. Works on shared hosting, containers, and anywhere you can't install extensions.
single file
One-file UI
The whole viewer ships as a single HTML file. Point it at your traces - or open it offline with sample data.

Free, forever.

filo is MIT-licensed and built in the open. Star the repo, file issues, send pull requests - it all helps.

Star on GitHub